Chord Length
Chord Length measures the straight spans through the pores, or through the solid, along each axis. Use it as a direct measure of pore extent, and as the simplest test for anisotropy: layered or elongated pores give different spans along different axes.
- Find it Tools › Statistics › Chord Length
- Needs a segmented 3D image, up to 1024³ voxels
- Returns one chord length distribution for each of X, Y and Z, and the median chord length \(\ell_{50}\) along X
- Runs on CPU, with PoreSpy
- Science Chord Length
Run it
- Open Tools, then Statistics, and select Chord Length. You can also start from an image's page, which fills in the image for you.
- Under Source, choose the Image, or a batch to run every image in it.
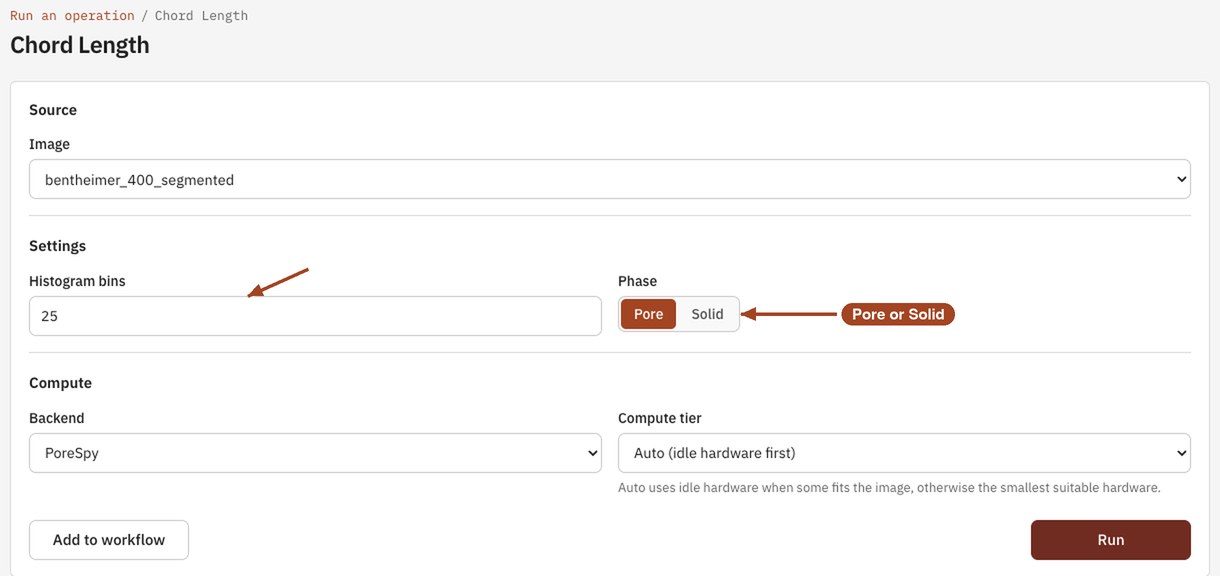
- Under Settings, choose the Phase, Pore or Solid, if your team has the choice, and the number of Histogram bins.
- Under Compute, the Backend is PoreSpy.
- Select Run. The job page opens and follows the job until it finishes.
All three axes are measured in every job.
Settings
| Setting | Default | Range | What it does |
|---|---|---|---|
| Image | your team's images and batches | The image to analyse, or a batch to run one job per image. | |
| Phase | Pore | Pore, Solid | The phase whose chords are measured. Solid chords describe grain and wall thickness. Shown when your team can measure the solid. |
| Histogram bins | 25 |
2 or more | Number of equal-width bins for each axis's distribution. |
| Backend | PoreSpy | PoreSpy | The software that runs the analysis. |
| Compute tier | Auto | Auto, or a tier your team may use | Shown only when your team can choose the machine. Every tier gives the same answer. See Compute and hardware. |
Results
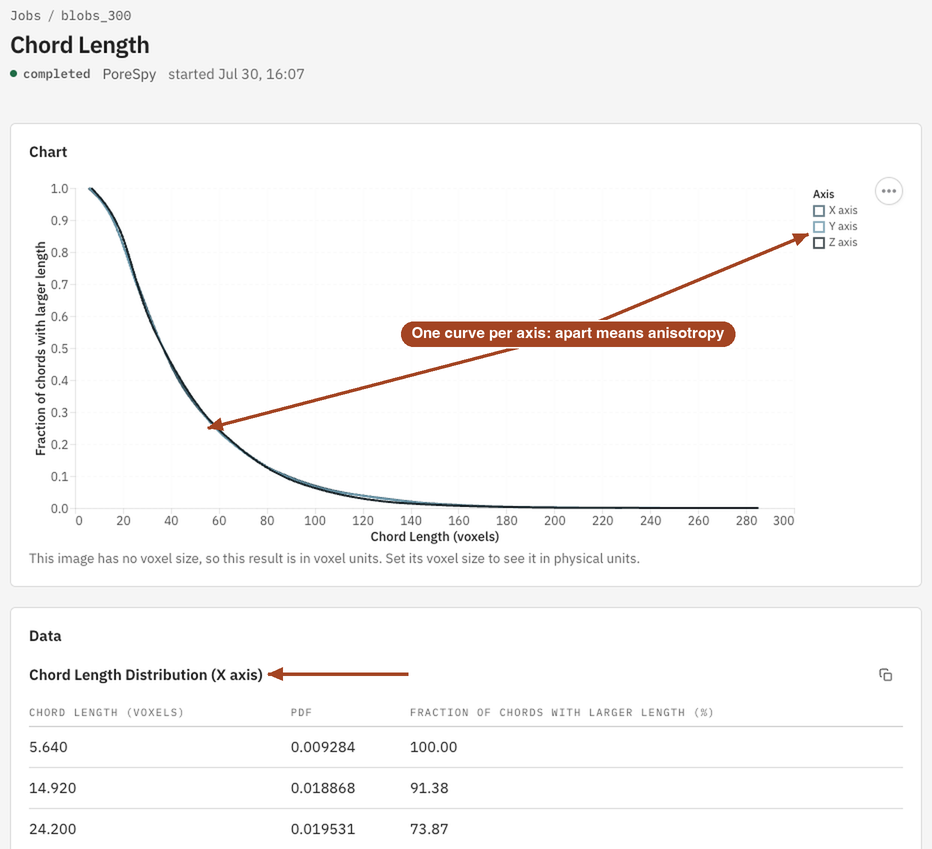
The Jobs list and the report sum the result up as the Median chord length \(\ell_{50}\) along X. The job page shows:
- Chart: the Fraction of chords with larger length against Chord Length, one curve per axis, in µm once the image has a voxel size and in voxels otherwise.
- Data: a Chord Length Distribution table for each axis, with each bin's length, density and fraction of chords that are longer.
Curves that lie on top of each other mean the pores have no preferred direction. A curve to the right of the others means longer chords, so pores elongated or layers aligned along that axis.
From the job page you can Download Report as PDF or HTML and Run Again, for example on the solid.
Common problems
- An axis has no curve. No chord along that axis ends at the other phase on both sides inside the image, usually because the image is thin along it. Chords cut by the image's edge are left out.
- Long pores barely show. The longer a chord, the likelier it is to reach the image's edge and be left out, so chords nearly as long as the image are under-counted.
- Only X in the summary. The median shown in the Jobs list is along X. Read the other axes from the chart and tables.
Science
How the chords are sampled, binned and related to surface area: Chord Length in the Scientific reference.